

Climate Modeling
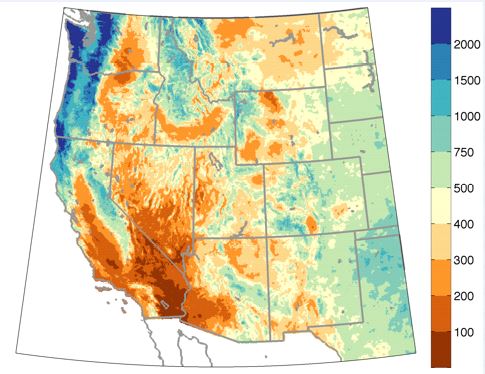
Calendar year precipitation (units in millimeters) for 2015 across the western US from the gridMET dataset of Abatzoglou (2013).
Resolving historical and future climate data at local scales
Issue: Climate provides a template for agricultural productivity and crop suitability. In dryland systems, for example, moisture availability is critically important in determining wheat yields and crop rotations. Changes in climate due to man-made climate change may impact the viability of dryland wheat farming. To best understand the impacts of climate variability and change on agricultural systems requires advancing methods for resolving both historical and future climate at local scales.
Action taken: We developed a historical gridded surface meteorological dataset, a downscaled season forecast dataset, and a statistical downscaling method to translate coarse-resolution climate model output to local scales to facilitate climate impacts assessments.
Results: The surface gridded meteorological dataset provides relatively high-resolution data on surface weather variables from 1979 through the present, updated daily. The downscaled seasonal forecast dataset provides place-based forecasts of temperature and precipitation for the next one to seven months from seven climate models. The statistical downscaling method allows for place-based projections of climate across multiple variables that are important for agricultural, hydrological, and ecological modeling, including temperature, precipitation, humidity, winds, and solar radiation.
Our datasets have been extended for use across the contiguous US and are being used by other coordinated agricultural projects (CAPs), U.S. Geological Survey climate science centers, U.S. Department of Agriculture climate hubs, the U.S. Forest Service, and many individual researchers to better understand climate variability, change, and impacts. We have developed numerous visualization aand decision-support tools hosted through the Northwest Knowledge Network that disseminates this information. These websites include:
- Historical Data: http://climate.nkn.uidaho.edu/METDATA/
- Downscaled seasonal forecasts: http://climate.nkn.uidaho.edu/downscaledForecast/
- Downscaled Projections: http://climate.nkn.uidaho.edu/MACA/
- REACCH climate tools: http://climate.nkn.uidaho.edu/REACCH/climateTools.php
Results published in:
- Abatzoglou, J. T. 2013. Development of gridded surface meteorological data for ecological applications and modeling. International Journal of Climatology 33: 121–131.
- Abatzoglou, J. T., and T. J. Brown. 2012. A comparison of statistical downscaling methods suited for wildfire applications. International Journal of Climatology 32: 772–780.
- Barbero, R., J. T. Abatzoglou, and K. C. Hegewisch. 2017. Evaluation of statistical downloading of North American Multi-Model Ensemble hindcasts over western USA. Weather and Forecasting. Accepted.
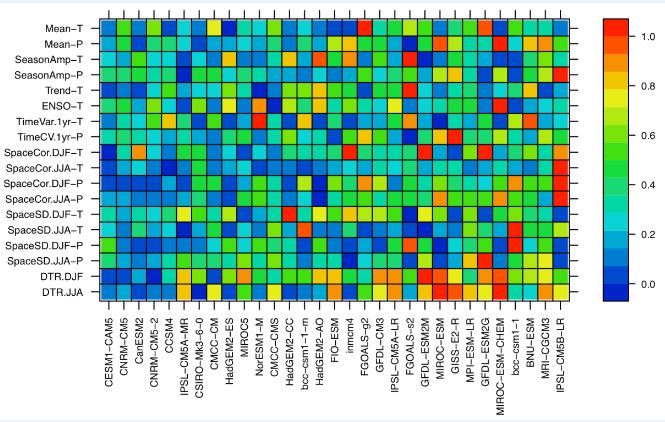
Matrix of climate model credibility adapted from Rupp et al. (2013). The colors show the relative error for each performance metric (listed along the y-axis) for each climate model (listed along the x-axis), where the better performing models have lower errors as indicated by cooler shades. The ordering of climate models along the x-axis corresponds to the ranking of total relative error across all metrics, listed from the most credible (left) to least credible (right)
Evaluating climate-model credibility
Issue: The number of climate models available results in a large amount of potentially useful information for assessing regional climate impacts. However, some of the models may be better suited than others to providing credible projections about future climate. Formally evaluating the credibility of models provides an objective approach for selecting a subset of models for regional climate-change assessments.
Action taken: We developed a statistical approach for comprehensively evaluating the credibility of climate models for simulating climate characteristics of the northwestern US. In addition, we sought models flexible enough to be applied to other regions.
Results: We developed a set of performance metrics for capturing seasonal and spatial patterns of temperature and precipitation across the northwestern US and implemented them for over 40 climate models. From the broader set of models, we selected those with higher relative credibility. Our evaluation has been adopted by numerous studies that have used climate models in the region and has assisted in the selection of climate simulations for the southwestern and southeastern US.
Results published in:
- Rupp, D. E., J. T. Abatzoglou, K. C. Hegewisch, and P. W. Mote. 2013. Evaluation of CMIP5 20th century climate simulations for the Pacific Northwest USA. Journal of Geophysical Research-Atmospheres 118(19): 10884–10906.
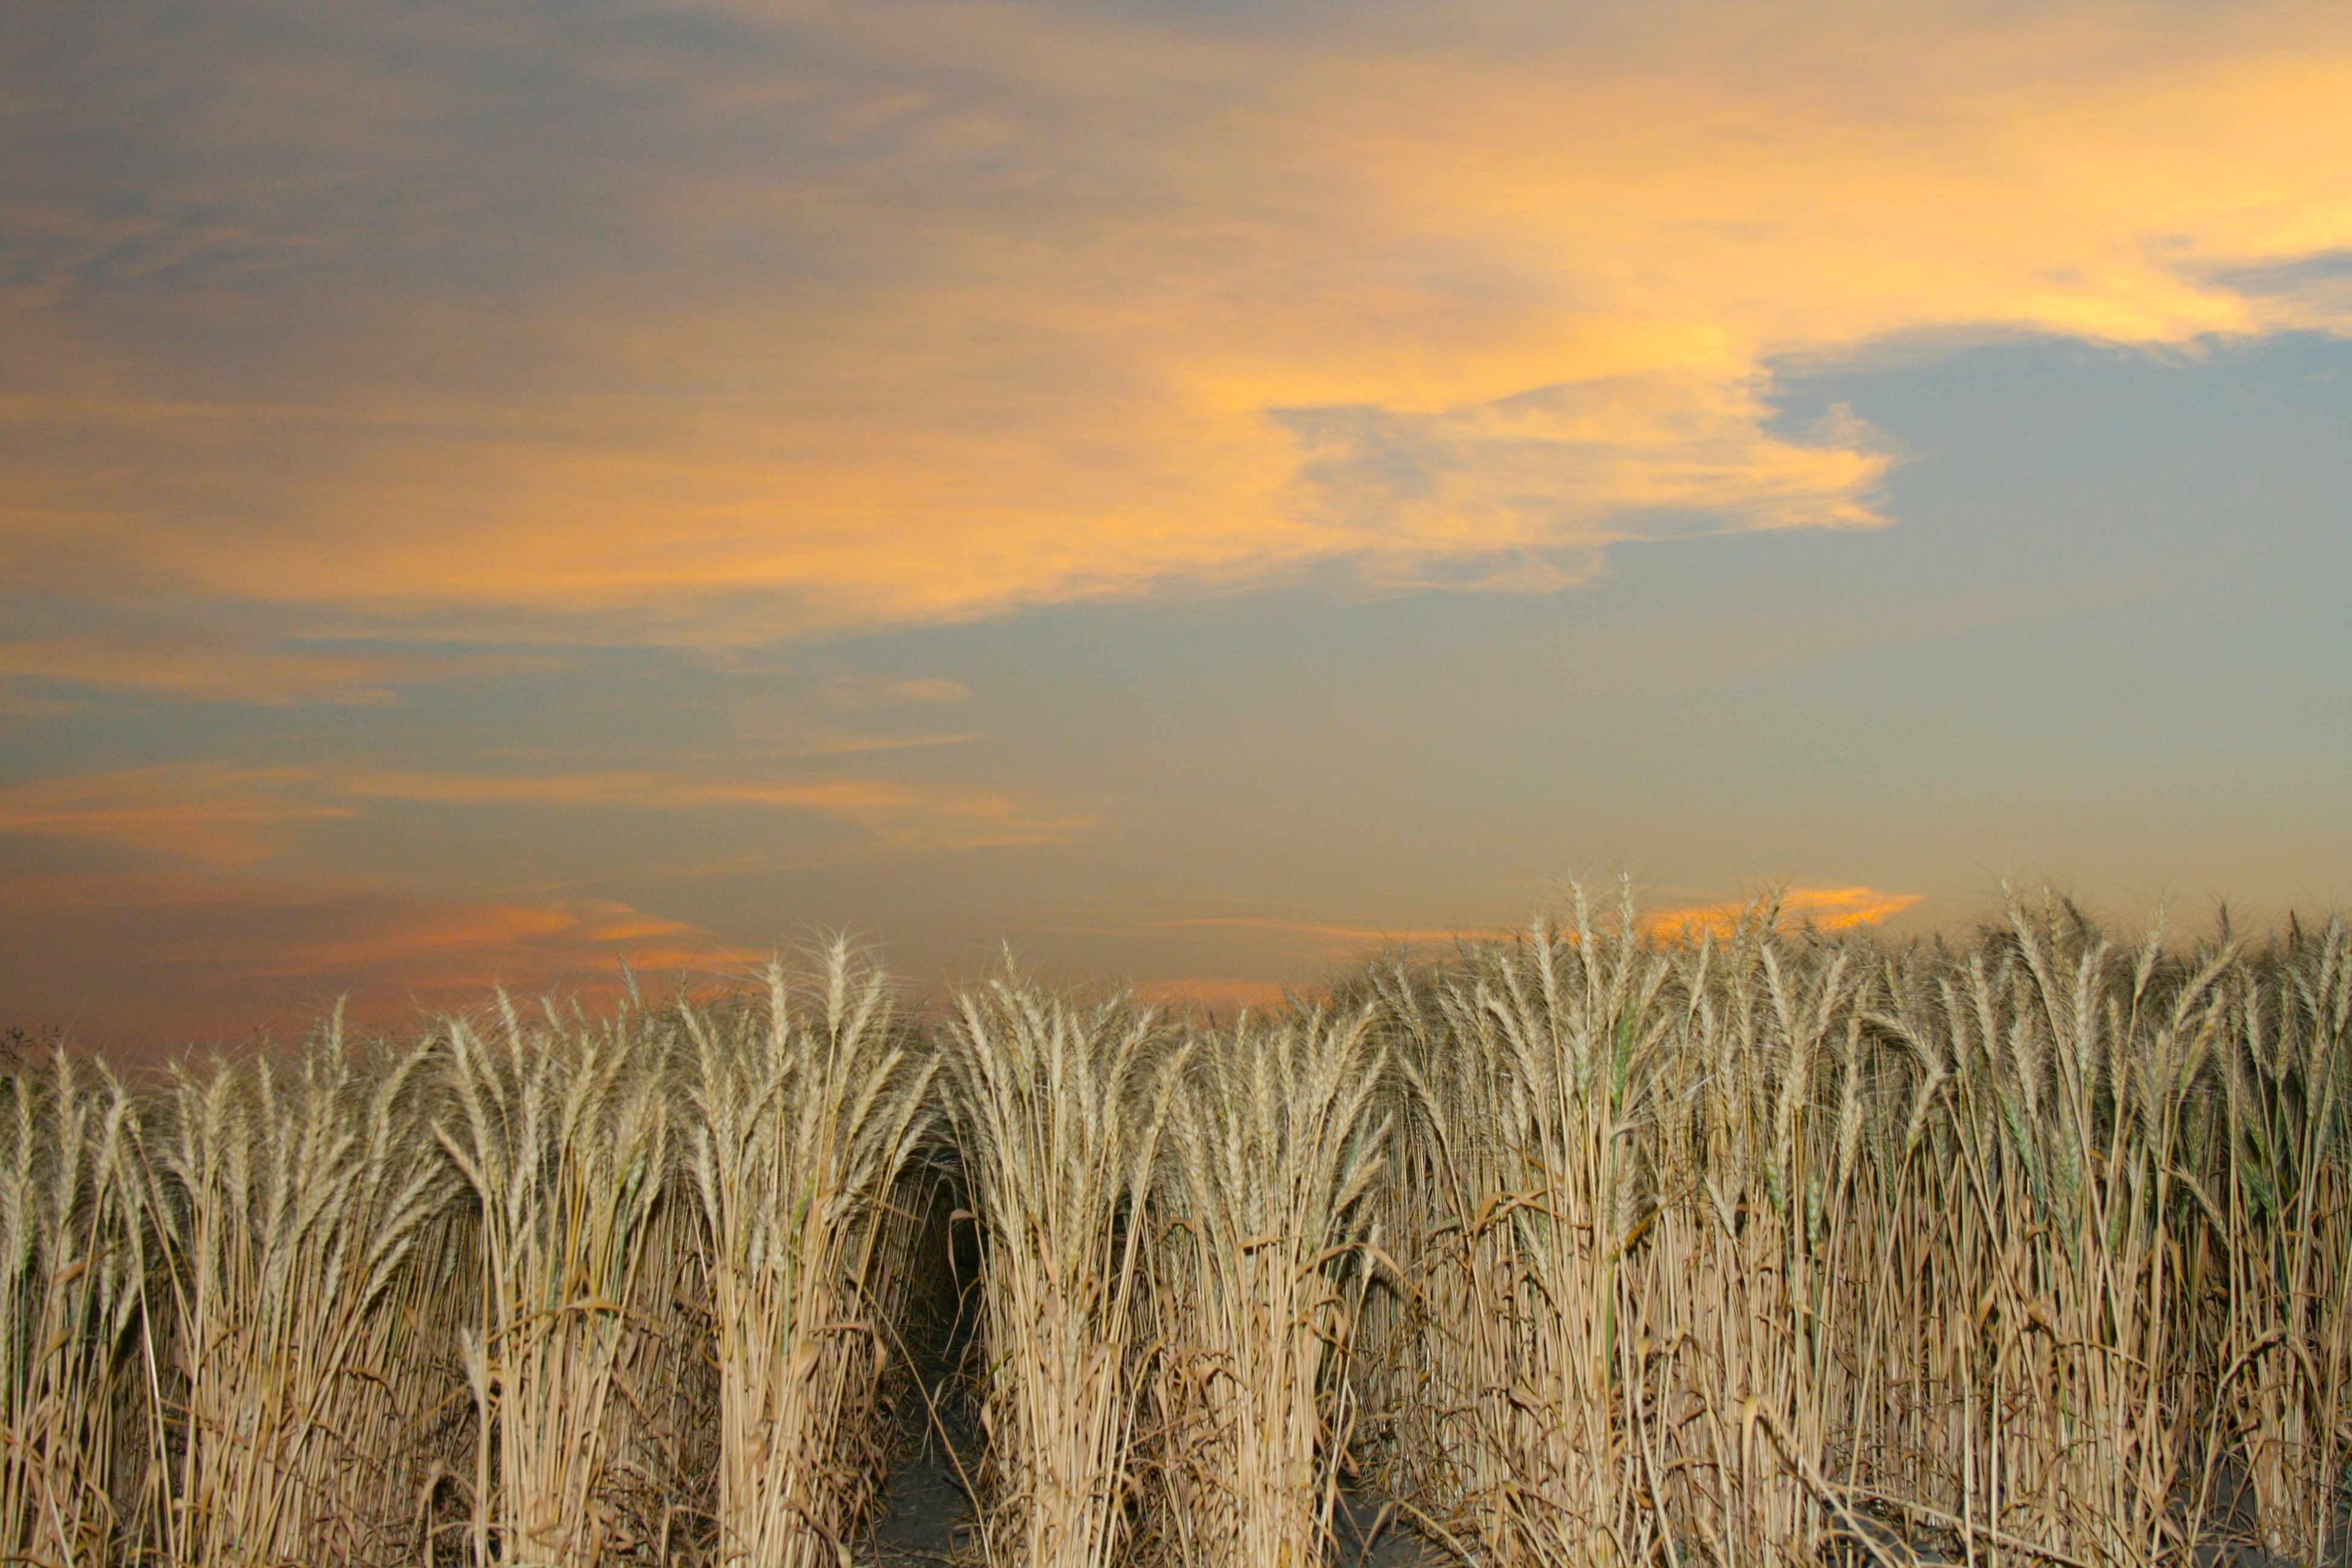
Wheat May Fare Better Under Climate Change than Normally Assumed
Issue: The long-term sustainability of wheat-based dryland cropping systems in the inland Pacific Northwest (PNW) depends on how these systems adapt to climate change. Climate models project warming in the region, with drier summers and slight increases in winter precipitation. These conditions are likely to decrease yields, particularly of spring crops, although adaptations such as earlier planting will help delay negative effects. However, the rising levels of atmospheric carbon dioxide (CO2) that are driving global warming also have direct beneficial effects on crops, promoting crop growth and improving wateruse efficiency. This effect, sometimes referred to as “CO2 fertilization,” might mean that the future of dryland agriculture is better than it is assumed to be when considering climate warming alone.
Action taken: To understand the interaction between climate change and increasing atmospheric CO2 in the inland PNW and its impact on regional wheat-based systems, we used computer simulations that combined cropping systems models with weather generated from projections by 12 global circulation models. The models considered two levels (low and high) of increasing atmospheric CO2 and associated warming (higher warming associated with higher atmospheric CO2). We developed projections of future crop yields for this century and compared them with baseline yields for the period 1979 to 2010.
Results: Despite the common assumption of negative climate change impacts on agricultural production, computer simulations indicated that wheat productivity will actually increase in the inland PNW for most of the century. Higher winter and spring temperatures should benefit the growth of winter crops and allow for earlier planting of spring crops. Earlier maturity of both types of crops would help avoid the more extreme and damaging summer heat.
Considering only climate change (temperature increase and some change in precipitation but no CO2 fertilization effect), yields were projected to remain constant throughout the century at the lower level of warming but to first increase and then decline below baseline values at the higher level of warming. When CO2 fertilization effects were included, wheat yields for the lower levels of atmospheric CO2 and warming were projected to have a small and steady increase until the end of the century, but at higher levels of atmospheric CO2 and warming, wheat yields were projected to increase up to midcentury and then decline by the end of the century to levels generally similar to baseline.
Results published in:
- Ahmed, M., C. O. Stöckle, R. Nelson, and S. Higgins. Assessment of climate change impact on winter wheat in the US Pacific Northwest using a multi-model ensemble. Frontiers in Ecology and Evolution. In review.
- Karimi, T., C. Stöckle, S. Higgins, and R. Nelson. Climate change and dryland wheat systems in the US Pacific Northwest. Agricultural Systems. In review.
- Karimi, T., C. O. Stöckle, S. Higgins, and R. L. Nelson. Projected dryland cropping system shifts in the Pacific Northwest in response to climate change. Frontiers in Ecology and Evolution. In review.
- Stöckle, C. O., S. Higgins, R. Nelson, J. Abatzoglou,D. R. Huggins, W. L. Pan, T. Karimi, J. Antle, S. Eigenbrode, E. Brooks. Evaluating opportunities for an increased role of winter crops as adaptation to climate change in dryland cropping systems of the U.S. Inland Pacific Northwest. Climatic Change. In review.
- Stöckle, C. O, R. L. Nelson, S. Higgins, J. Brunner, G. Grove, R. Boydston, M. Whiting, and C. Kruger. 2010. Assessment of climate change impact on eastern Washington agriculture. Climatic Change 102:77–102.
 ,
, 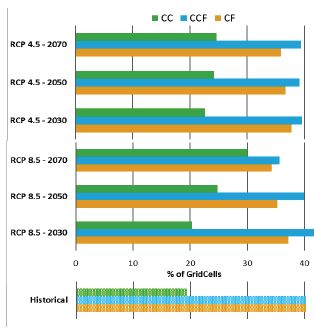
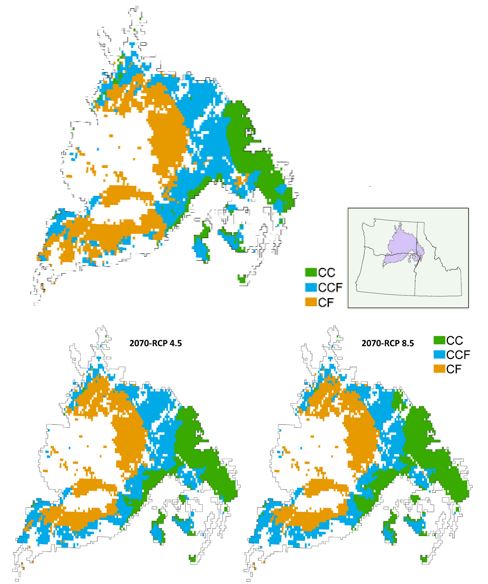
Top: Historical (1979-2010) and future (2055-2085) agroecological classes. Bottom: Average percentage of cells in CF, CCF, and CC agroecological classes during historical (1897 to 2010) and future (2030s, 2050s and 2070s) periods, considering RCP4.5 and RCP8.5 atmospheric CO2 scenarios.
Will the distribution of dryland cropping systems in the inland Pacific Northwest be affected by climate change?
Issue: The dryland agricultural region of the inland Pacific Northwest (PNW) includes northern ID, eastern WA, and northern OR. REACCH scientists have used U.S. Department of Agriculture crop data from 2007 to 2011 to classify the inland PNW dryland area into agroecological classes based on the percentage of fallow land. Crop-fallow (CF) has 40% or more fallow, annual crop-fallow transition (CCF) has 10 to 40% fallow, and annual cropping (CC) has less than 10% fallow. Climate change in the next century will potentially affect water use and yields of water-limited dryland crops. Will these changes affect the distribution of agroecological classes, and thus of cropping intensity in the region?
Action taken: To understand the interaction between climate change and increasing atmospheric carbon dioxide (CO2) in the inland PNW and its impact on regional wheat-based systems, we used computer simulations that combined cropping systems models with weather generated from projections by 12 global circulation models. The models considered two levels of increasing atmospheric CO2 and associated warming—low, RCP4.5, and high, RCP8.5, where RCP is the Representative Concentration Pathway of atmospheric CO2. We developed projections of future crop yields and water use for this century and compared them with baseline yields for the period 1979 to 2010. Based on this simulated data, we projected the distribution of agroecological classes for later in this century.
Results: Figure 1 shows the spatial distribution of agroecological classes during historical (1979 to 2010) and future (2030s, 2050s, and 2070s) periods. Figure 2 shows the average percentage of cells in CF, CCF, and CC agroecological classes, considering RCP4.5 and RCP8.5 atmospheric CO2 scenarios. Because simulations projected increased water-use efficiency and wheat productivity for most of the century, the fraction of the regional area occupied by CC (the most-intense cropping system) tended to increase, while CF (the lowest-intensity cropping system) decreased in all future periods and RCP scenarios. The area under transitional CCF remained basically the same. These results are based on average values, but the picture is essentially the same if we use yields for 70% probability of exceedance (better or similar yields are obtained 70% of the years), which are more representative of farmers’ decisions that minimize risk.
Results published in:
- Karimi, T., C. O. Stöckle, S. Higgins, and R. L. Nelson. Projected dryland cropping system shifts in the Pacific Northwest in response to climate change. Frontiers in Ecology and Evolution. In review. Stöckle, C. O., S. Higgins, R. Nelson, J. Abatzoglou, D. R. Huggins, W. L. Pan, T. Karimi, J. Antle, S. Eigenbrode, and E. Brooks. Evaluating opportunities for an increased role of winter crops as adaptation to climate change in dryland cropping systems of the U.S. Inland Pacific Northwest. Climatic Change. In review.
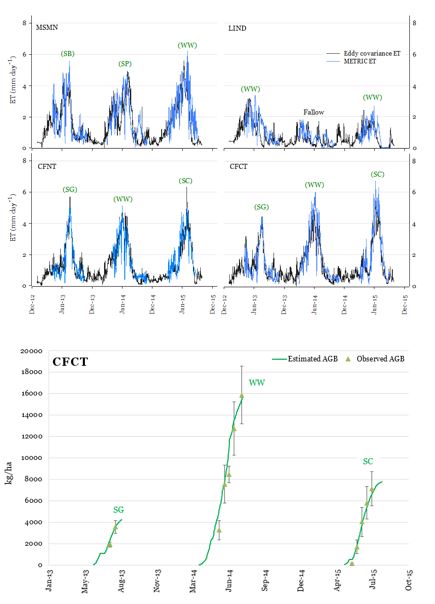
Above: Daily time-step comparison of METRIC and EC ETa at four REACCH sites (MSMN, LIND, CFNT, and CFCT) and three growing seasons. Abbreviations: SB=Spring Barley, SP=Spring Pea, WW=Winter Wheat, SG=Spring Garbanzo, SC=Spring Canola. Below: Comparison of remote sensing–simple crop growth algorithms and measurements of seasonal progression of aboveground biomass (AGB) accumulation for three crops at the CFCT site.
Regional estimation of water use and yields based on remote sensing and simple crop growth algorithms
Issue: From the perspective of global food security under population increase and climate change, regional monitoring of cropping systems, water use, and crop yields are of significant interest for land management, food pricing, and trading policies. Monitoring data are difficult to obtain on a real-time or nearreal-time basis at large scales, however, since crop models, statistical models, and other similar approaches are either difficult to implement and parameterize or include sizeable uncertainty. Remote sensing data offer significant promise for regional assessment and crop yield forecasting if image processing can be enhanced by software development and linked with simple cropmodeling algorithms.
Action taken: We have adapted and evaluated METRIC for use in the dryland area of the inland Pacific Northwest. This remote sensing-based method uses an energy balance approach to estimate actual crop evapotranspiration (ETa = sum of crop water use and soil water evaporation) without having to specifically account for hydrological, soil water, and crop processes. We compared estimations of ETa with eddy covariance measurements at four REACCH study sites, across three seasons and five different crops, and with annual precipitation ranging from 247 to 680 millimeters. After METRIC evaluation, we linked simple crop-growth algorithms and topsoil water balance to 30 x 30 meter resolution estimates of ETa to calculate crop water use, seasonal biomass production, and grain yields.
Results: Remote sensing-based METRIC estimates of ETa compared well with on-the-ground measurements obtained with eddy covariance instrumentation, with standard errors ranging from 0.3 to 0.5 millimeters per day for satellite overpass days and 0.4 to 0.8 millimeters per day for other days, with the higher bias generally associated with fallow periods. The daily progression of METRIC ETa at all sites and among all crops reasonably matched eddy covariance measurements without any calibration for specific crops or sites (top).
Our evaluation found that METRIC can estimate ETa in dryland areas, where crops are often limited by water, with similar accuracy to that reported for irrigated crops. Combining METRIC ETa with simple crop-growth and topsoil water balance algorithms resulted in seasonal aboveground estimates that compared well with direct measurements at all sites, as shown (bottom) for one of the sites evaluated. These are very encouraging preliminary results that may lead to the development of reasonably accurate regional assessments of evapotranspiration and crop yields forecasting.
Results published in:
- Khan, M.A., C. O. Stöckle, R. Nelson, and J. Chi. Estimating biomass production and yield of dryland crops using remote sensing and a simple crop model. Agricultural and Forest Meteorology. In review.
- Khan, M. A., C. O. Stöckle, T. Peters, J. C. Adam, R. G. Allen, R. Trezza, B. Lamb, and J. Chi. Evaluation of METRIC for estimation of actual evapotranspiration from dryland agricultural systems in eastern Washington State. Remote Sensing of Environment. In review.
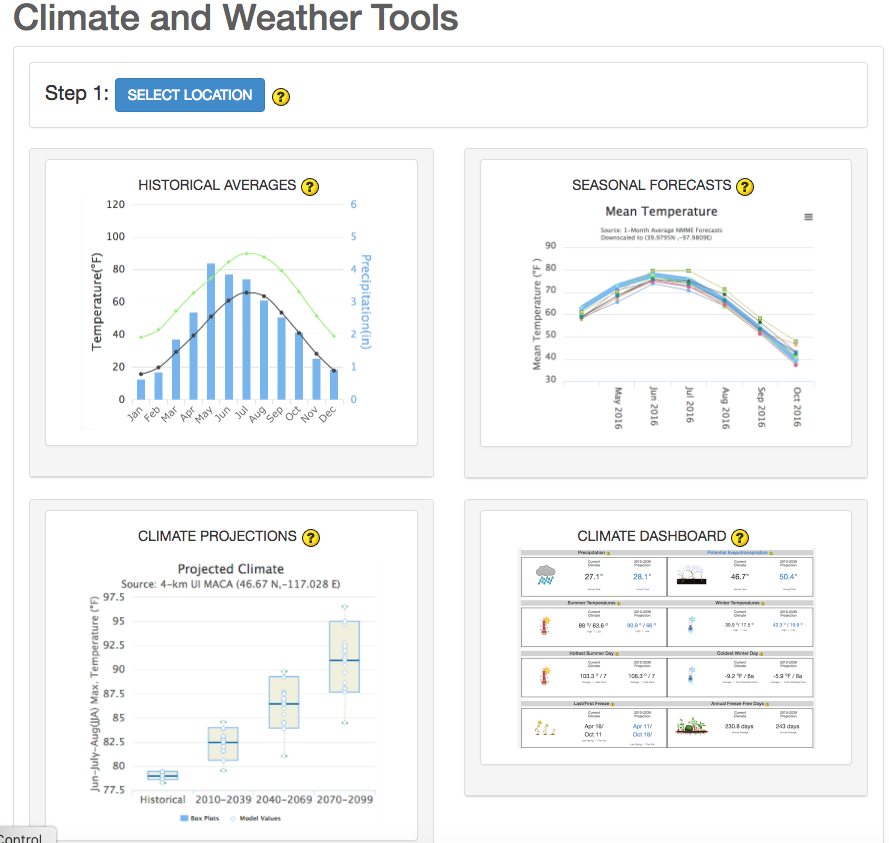
Landing webpage for REACCH climate and weather tools showing the four tools related to past observations, seasonal forecasts, and future climate projections.
REACCH produces web-based climate and weather tools
Issue: The REACCH project produced over 20 terabytes (TB) of climate data, including historical gridded meteorological observations, seasonal climate forecasts, and future climate projections covering the contiguous US at a 4-kilometer (2.5 mile) resolution. This data has been largely inaccessible to researchers and stakeholders due to its sheer size, unfamiliar format, and lack of tools to analyze the data.
Action taken: We developed a set of climate and weather web tools that utilize REACCH climate datasets to both create interactive graphics and acquire datasets in accessible formats. The climate and weather tools allow users to extract and visualize climate data for any location in the contiguous US. We developed tools to examine summaries of historical and future climate as well as seasonal forecasts for the next seven months.
Results: The climate and weather tools allow visualization of the REACCH datasets over the contiguous US and are currently accessible through Decision Support Tools at the REACCH website. These tools are being integrated into two other sets of web tools—the Northwest Climate Toolbox (http://climatetoolbox.org) and the Integrated Scenarios website (http://climate.nkn.uidaho.edu/IntegratedScenarios/)—which are being used by U.S. Geological Survey climate science centers, U.S. Department of Agriculture climate hubs, the U.S. Forest Service, and many individual researchers to better understand climate variability, change, and impacts.
Learn more about REACCH tools at http://climate.nkn.uidaho.edu/REACCH/climateTools.php and https://www.reacchpna.org/tools
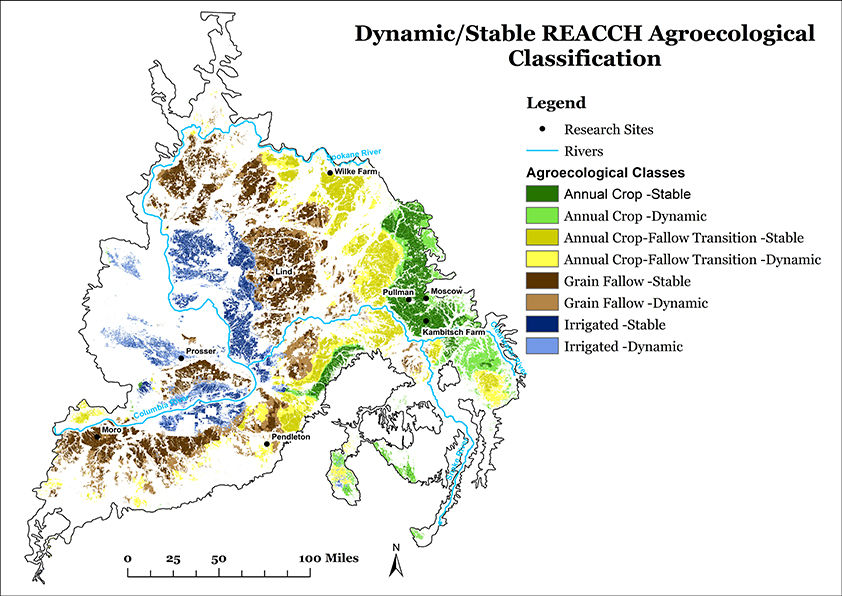
Stable and dynamic agroecological classes (AECs) for the REACCH region based on 2007 through 2013 cropland data layers.
Defining agroecological classes for assessing land use dynamics
Issue: Defining agroecological classes (AECs), which classify land use, cover, and changes through time, enables researchers, stakeholders, students, the public, and policy makers to acquire a more holistic understanding of agriculture and climate change. AECs are intended to be part of a prescription for land management that, given climate change, will support and enhance the use of information from climate models; socio-economic models; crop models; pest, disease, and weed vulnerabilities; and many other data sources.
Action taken: We originated the concept of Dynamic AECs, developed methodology for quantifying AECs, and produced regional maps of Dynamic AECs that show the major dryland cropping systems of the inland Pacific Northwest. The Dynamic AECs use the annual NASS Cropland Datalayer and quantify annual and long-term changes in major cropping systems, crops, and overall land use.
Results: Many REACCH investigators have used the AEC concept to frame their research and to give it agricultural context. They have documented changes in cropping systems and in specific crops on an annual basis. Regions where AECs were stable or dynamic have been identified, enabling hypothesis development to further understand land-use change.
Results published in:
- Huggins, D. R., H. Kaur, R. Rupp, and J. Abatzoglou. Dynamic agroecological classes for assessing land use change in the Inland Pacific Northwest. PLOS ONE. In review.
Changing bioclimatic drivers increase future uncertainty of agroecosystem classes
Issue: Future climate change may result in major shifts in the location and extent of dryland agricultural systems, currently defined as agroecological classes (AECs).
Action taken: We assessed the relationship between the location and extent of the REACCH region’s current AECs and different bioclimatic variables such as evapotranspiration and precipitation. Using the predictive relationship between bioclimatic variables and AECs, we assessed how current AECs would shift if we imposed future climate projections onto our current AECs.
Results: We found that climate change could cause substantial increases in the geospatial extent of annual fallow (no crop grown for a year) at the expense of annual cropping. If the extent of fallow does increase in the future, it would negatively impact cropping system diversification and intensification, soil organic matter, and soil vulnerability to erosion processes.
Results published in:
- Kaur, H., D. Huggins, R. Rupp, J. Abatzoglou, and J. Reganold. Changing bioclimatic drivers increase future uncertainty of agroecosystem classes of the Northwest, USA. Frontiers in Ecology and Evolution. In review.
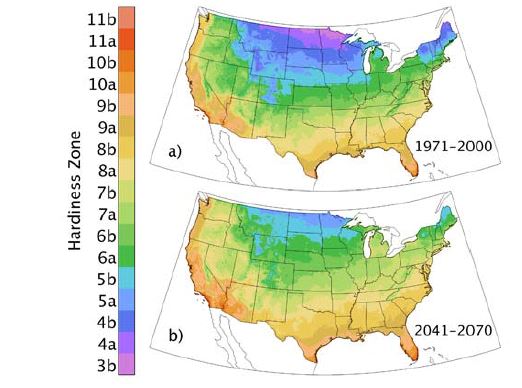
The shift in USDA cold hardiness zones projected by global climate model outputs from 1979-2000 to mid-21st century (2040-2069).
Projected changes in cold hardiness zones of perennial crops
Issue: Climate is one factor that shapes the geographic zones suitable for crop cultivation. Among the limiting factors for coldintolerant perennial agriculture are overwinter temperatures. Climate change will likely change the geography of where cold intolerant crops can be cultivated.
Action taken: We used downscaled climate projections for the mid-21st century to calculate changes in cold hardiness zones as defined by the average minimum temperature each winter.
Results: Amplified warming of approximately 40% was projected for the coldest night of the winter compared to average winter temperatures across much of the US. This results in wholesale shifts in cold hardiness zones by approximately one zone by the mid-21st century, equivalent to an average northward shift of current cold hardiness zones by 60 miles. While this may increase the potential for cultivating cold-intolerant crops farther north, it could also increase pressure from invasive species and pests with subsequent impacts on agricultural economics and adaptation efforts.
We developed an interactive map of these projections, which is accessible at: http://climate.nkn.uidaho.edu/REACCH/decisionTools.php
Results published in:
- Parker, L. E., and J.T. Abatzoglou. 2016: Projected changes in cold hardiness zones and suitable overwinter ranges of perennial crops over the United States, Environmental Research Letters 11: 034001.