

Technological advances and mobile applications have improved the ability of decision makers to gather information and make choices. Dependable, research-based tools can assist farmers and agricultural land managers in making informed management choices and improve on-farm practices. The following decision support tools have been developed based on specific needs faced by dryland cereal farmers in the Pacific Northwest.
Decision Support Tools
AgBizLogic
AgBizLogicTM is a suite of economic, financial, and environmental decision tools for businesses that grow, harvest, package, add value, and sell agricultural products. Tools include:
- AgBizProfitTM: Evaluate short-term, medium-term, and long-term capital investments.
- AgBizLeaseTM: Calculate equitable short-run and long-run crop leases, including crop share percentage and annual cash rent payment.
- AgBizFinanceTM: Evaluate investment decisions based on liquidity, solvency, profitability, and efficiency.
- AgBizEnvironmentTM: Measure and track environmental aspects, including pesticides, herbicides, fertilizer, energy use, and tillage practices.
- AgBizClimateTM: Project potential changes in yield and production inputs due to climate change.
Climate Engine
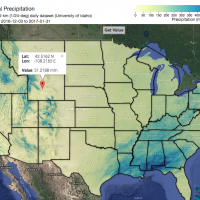
Climate Engine is a web tool for visualizing summaries of climate and remote sensing datasets (Landsat and MODIS) available on the Google Cloud.
Features of interest for REACCH users include:
- Customized maps and time series of data for point locations or as area averages over a customized region
- Customized climate and remote sensing metrics, including proxies for vegetation cover (i.e. NDVI-normalized difference vegetation index)
- Customized time series showing year to year variations in seasonal climate variables (like min/max temperature, cumulative precipitation) or cumulative precipitation over the current growing season.
Aphid Tracker Maps
Aphid Tracker is a website with tools for managing pea aphids and the viruses they carry. It emphasizes aphid and aphid virus summer data collected in the Palouse region of Eastern Washington, USA. The Aphid Tracker Maps show the locations of pea aphid traps in the Palouse region by year between 2007-2019.
Features include:
- Clicking a trap site displays pea aphid counts over the season and what aphid viuses were present in the samples.
- Site locations are color-coded for the presence of different virus particles (e.g. BLRV, PEMV, PeSV in peas) in the collected aphids
Aphid Tracker Calculators
The Legume Virus Project is a website with tools for managing pea aphids and the viruses they carry. It emphasizes aphid and aphid virus summer data collected in the Palouse region of Eastern Washington, USA. Legume Virus Project Calculators (formerly the Aphid Tracker Calculators) are a suite of decision support tools based on data from previously conducted experiments with pesticide application efficacy on pea aphids and their viruses.
Tools include:
- Seed Treatment (Peas) - This tool provides advice on the decision to use different seed treatments for limiting the spread of the BLRV and PEMV pea viruses.
- Early Spray (Peas) - This tool provides advice on the decision to use insecticidal sprays for pea aphids early in the growing season by providing a table of gains and losses over different concentrations of two spray products.
- Late Spray (Peas/Lentils)- This tool provides advice on the decision to use insecticidal sprays for pea aphids early in the growing season by providing the break-even pest density (economic injury level) on either pea or lentil crops.
- Aphid Sampling (Peas) - This tool provides step-by-step directions on how to sample pea aphids in the field to quickly designate if a pea aphid infestation will have economic effect. The sampling method used is the Binomial Sequential Sampling Plan.
Historical Climograph
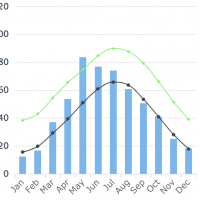
This tool provides a graphical summary of climate for a selected location by displaying monthly average mean temperature and accumulated precipitation from 1981-2010.
Data from the selected location represents the average climate over a ~2.5-mile by 2.5-mile resolution grid cell.
Seasonal Forecast Graphs
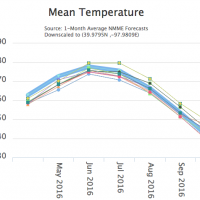
This tool provides a graphical summary of seasonal climate forecasts for a selected location by showing monthly average mean temperature and accumulated precipitation forecasts for the next seven months.
Data from the selected location represents the average climate over a ~2.5-mile by 2.5-mile resolution grid cell. Monthly averages from 1981-2010 are shown for comparison.
Future Boxplots
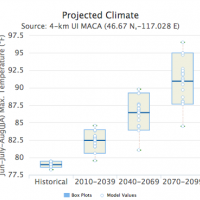
This tool provides a graphical summary of future climate projections for a selected location using boxplots of projections of multiple agricultural metrics from multiple global climate models for the early, mid and late 21st century.
Data from the selected location represents the average climate over a ~2.5-mile by 2.5-mile resolution grid cell.
Future Climate Dashboard
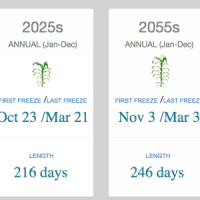
This tool provides a summary of climate projections for a selected location for a variety of agricultural metrics, shown in a dashboard display. Each region of the dashboard shows historically observed values for the metric and projected future values under different scenarios of future greenhouse gas emissions.
Data from the selected location represents the average climate over a ~2.5-mile by 2.5-mile resolution grid cell. Averages of historical observed values from 1981-2010 are shown for comparison.
Historical Climate Tracker
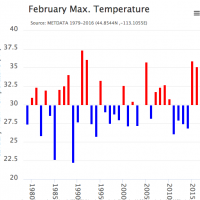
This tool provides a graphical summary of year-to-year variability in past climate variables(i.e. temperature, precipitation) over a season (i.e. winter, summer, annual).
Data from the selected location represents the average climate over a ~2.5-mile by 2.5-mile resolution grid cell.
Future Time Series
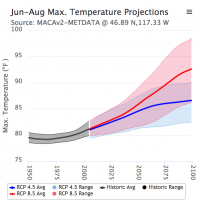
This tool provides a graphical summary of future climate projections for a selected location as a yearly time series of projections of climate variables from multiple global climate models over the 21st century, under a low and high future emission scenario.
Data from the selected location represents the average climate over a ~2.5-mile by 2.5-mile resolution grid cell.
Weather and Winter Wheat Yield
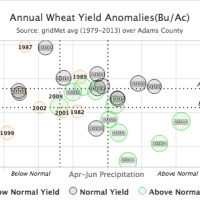
This tool shows graphical displays of year-to-year variability in winter wheat yields over the past three decades and its relationship to variabiity in late spring (Apr-Jun) precipitation and temperature. This tool also shows a graphical display of the distribution of future preciptiation and temperature over the 21st century.
This tool was based on research by a REACCH graduate student.
Future Cold Hardiness Zones
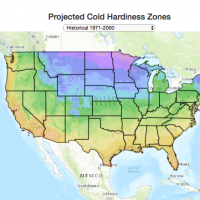
This tool shows how cold hardiness zones are projected to change in the early/mid/late 21st century under two future greenhouse gas emission scenarios.
The USDA Plant Hardiness Zone Map is the standard by which gardeners and growers determine which plants are most likely to thrive at a particular location. The map is based on the average annual minimum winter temperature, divided into 10-degree F zones.
Ths tool was based on the research of a REACCH graduate student.
Cereal Aphid Spray Calculator
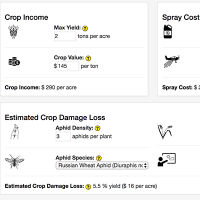
This is a Calculator to assist in deciding the overall gain/loss in spraying for cereal aphids based on the current aphid density, distribution of species of aphids, current climate, potential value of your crop and current costs involved in chemical control (i.e. spraying).