

Analyzing Regional Climate Models for the PNW
Climate models are the most sophisticated tool we have to better our understanding of how our climate will change.
Climate models have proven their utility in accurately reproducing past, observed changes in our climate. They have also shown the ability to pick up on key physical and human influences on our climate, improving confidence in their accuracy.
The most widely used form of climate modeling is the Global Climate Model (GCM). GCMs are most informative at the continental or country scale. They are used to give us a big picture understanding of projected climate change. GCMs are comprised of three-dimensional grid cells that take into account physical conditions of our atmosphere, ocean, sea surface, and sea ice at a given time. These grid cells are cubes with equal sides ranging from 100 km to 500 km.
Lack of Accurate Representation of Topography
The large size of these cells can be problematic when trying to address the effects of climate change on a regional scale. Particularly topography on regional processes is not as influential as in reality. With large resolution GCMs topography is “smoothed” over. Heights are averaged over areas that may include multiple magnitudes of peaks and valleys. This smoothing portrays an under-appreciated role of topography on the surrounding region.
Accounting for Topography
How do we try to better represent the role of topography? In order to account for the regional influence of topography we downscale our GCMs to create Regional Climate Models (RCMs).
RCMs are developed on finer resolutions with some as fine as 15 km. These finer resolutions allow grid cells to represent topographical profiles with higher fidelity. However, developing climate models with such fine resolutions on a global scale requires an extremely large amount of computing power.
Downscaling RCMs from GCMs allow the GCMs to run the global boundary conditions which the RCM uses for computations at the regional level. There are two approaches for downscaling: one approach is statistical downscaling and then second is dynamic downscaling. Statistical downscaling relies on using algorithms and statistics to identify future scenarios based on the boundary conditions from the GCM. Dynamic downscaling relies on the help of meteorological models to represent how the global boundary conditions could be altered by regional influences.
How can REACCH benefit?
REACCH can benefit greatly from the development of RCMs. RCMs will provide farmers and scientists with informative tools. A farmer is able to see how his wheat field in the Palouse region may be impacted by climate change while a scientist can assess how to address the effects of climate change on crop yield. Once the impact of climate change is realized for a region, research can go into how to best adapt agricultural practices to the changing climate. With the future development of RCMs finer and finer resolutions can become a reality. The development of finer resolutions would offer even more relevant future climate scenarios. Imagine, all of the options a farmer has for dealing with the weather, but with the precision of an RCM, really knowing which one to invest in for the future.
REACCH Undergraduate Summer Interns come from all over the country to spend 9 weeks with REACCH scientists conducting research, gaining job and graduate school training, and sharing their experiences. These blogs are the culmination of their research experience. Christian recently presented his findings at the Pacific Northwest Climate Science Conference in Seattle, WA.
Editor: Leigh Bernacchi
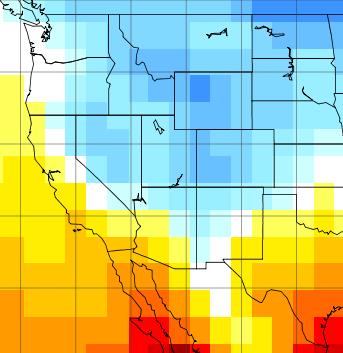
GCM model at 200km
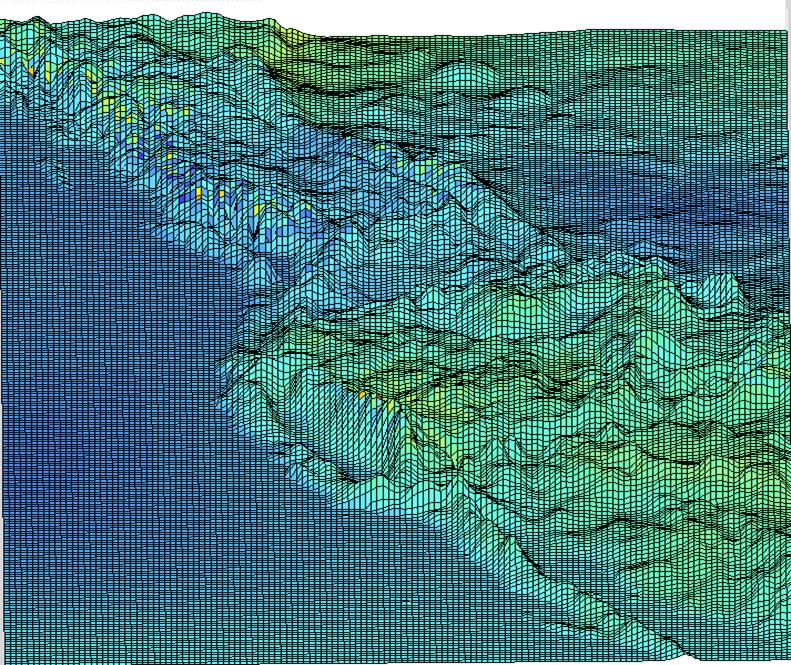
Dealing with topography
If you’re interested in climate and agriculture, continue reading articles at the blog aggregator, AgClimate.net