

Exploring Field Scale Variability with Remote Sensing and EMI Sensors
Precision agriculture utilizes information technologies to modify land management practices in a site-specific manner as conditions change spatially and temporally for optimum profitability, sustainability, and protection of the environment.
Precision agriculture deals with 5 “R’s”:
- Right input
- Right amount
- Right place
- Right time
- Right manner
How can we best use information technologies to help us achieve the five R’s of precision agriculture? The biggest challenge facing precision agriculture is delineating management zones and rates. How do we map variability on a field scale in order to delineate management zones and rates within a farm?
My project this summer focused on two information technologies that address the definition of management zones and rates: remote sensing and electromagnetic induction sensors.
The main objective of my project this summer was to find factors contributing to field-scale variability in bulk soil electrical conductivity. I looked specifically at the relationship between changes in electrical conductivity and soil moisture. I then looked at the potential of bulk electrical conductivity to delineate management zones for precision agriculture.
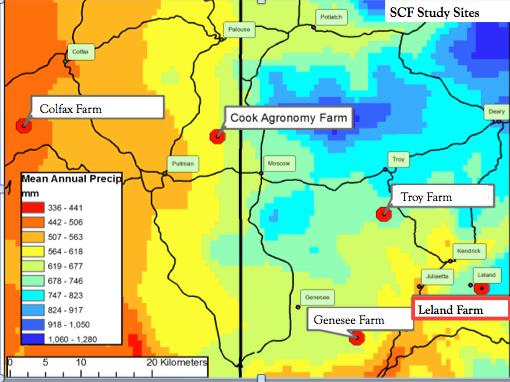
Map of the field sites for the NSF-funded Site-Specific Climate-Friendly Farming project. Our main field site this summer is the Leland Farm, Idaho.
Data available to farmers
Farmers have access to soil surveys and crop yield maps. The soil survey maps usually record one soil type on the scale of a farm. A farmer generates a crop yield map by measuring the height of the crop while harvesting the crop. Below is an example of a crop yield map at one of our field sites in Leland, Idaho. The farmer can delineate zones of variable nitrogen fertilizer application from the crop yield map- as of now, the application of variable fertilizer rates is practiced by a minority of farmers in the Palouse region. Yield maps alone do not give us enough insight to distinguish between the various factors influencing crop yield (see photo), such as varying weather, pests and diseases, and soil physico-chemical properties.
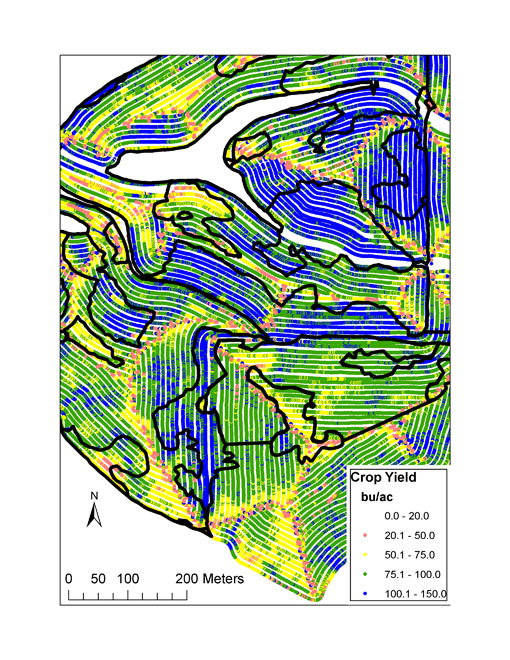
Crop yield and variable nitrogen fertilizer rate map at the Leland field site.
Data available to researchers
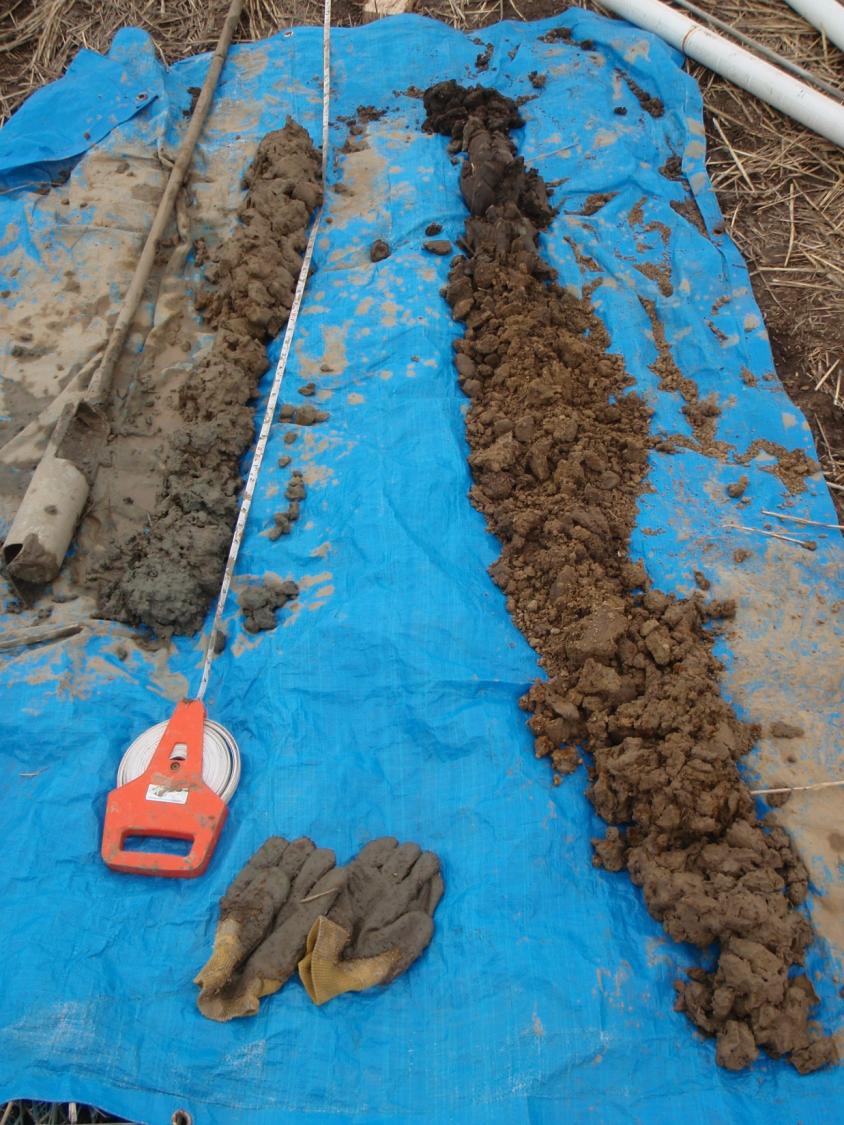
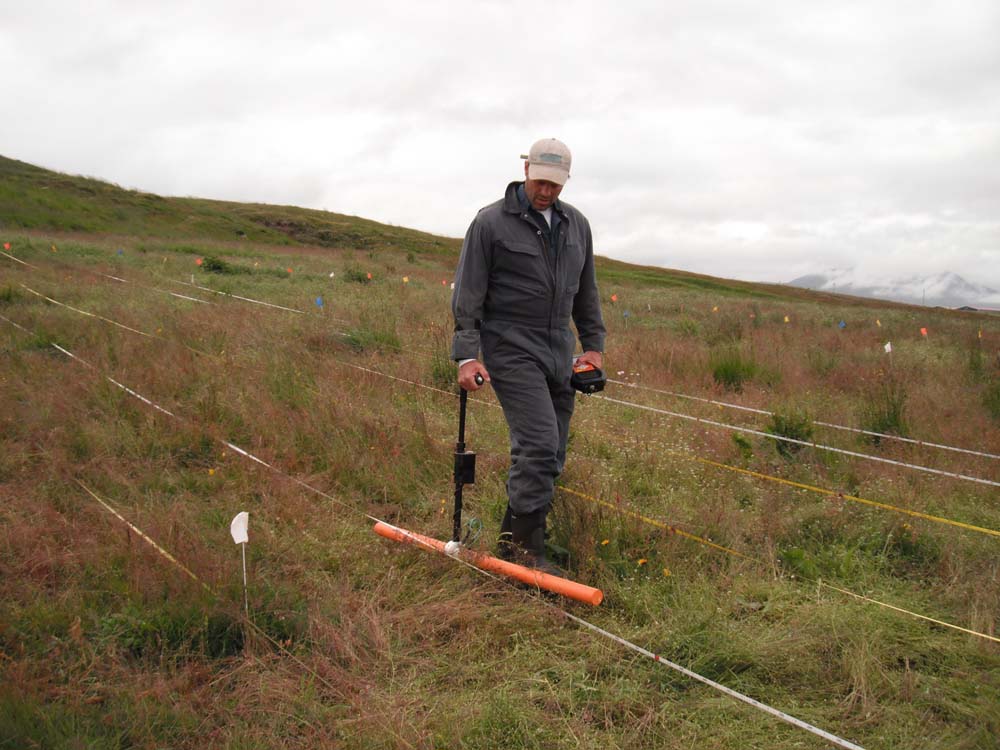
The soil data available to researchers is, by and large, in the form of point-source information. Different sampling methods include soil sensors, such as the ones we have at the Leland field site, that measure volumetric water content and temperature at every foot--up to five depths. Researchers can also use soil cores, time domain reflectometry, and a Giddings probe. These point-source sampling methods are time- and labor-intensive, and do not provide a good picture of field scale variability.
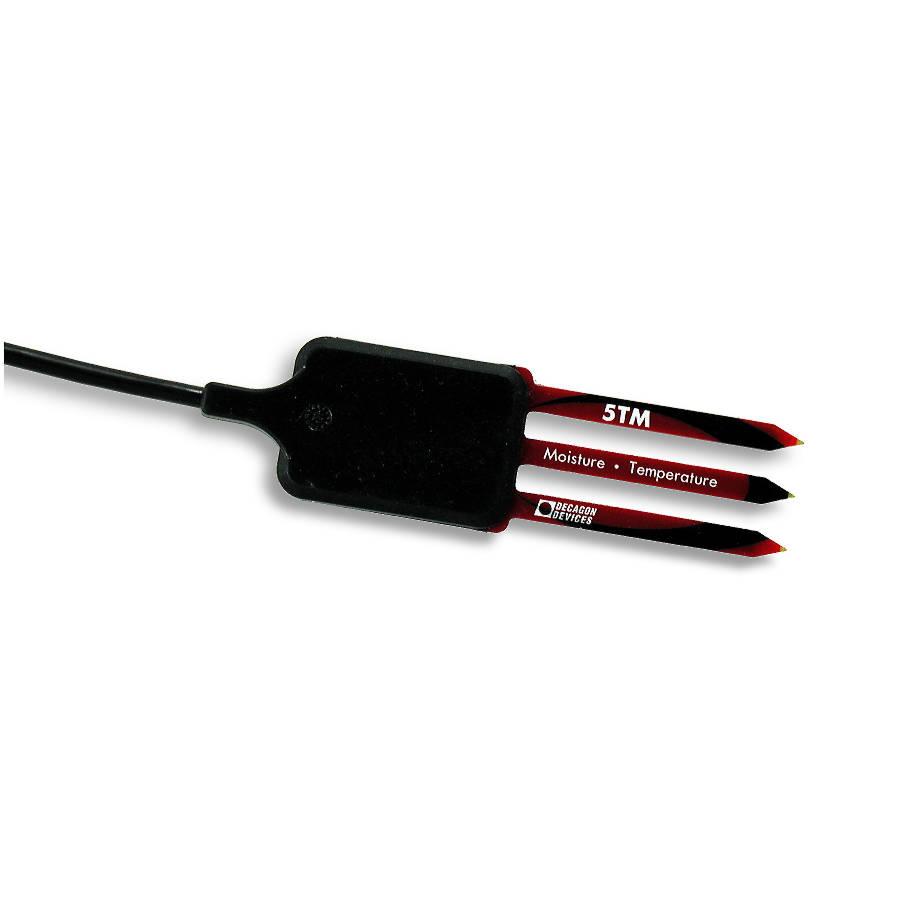
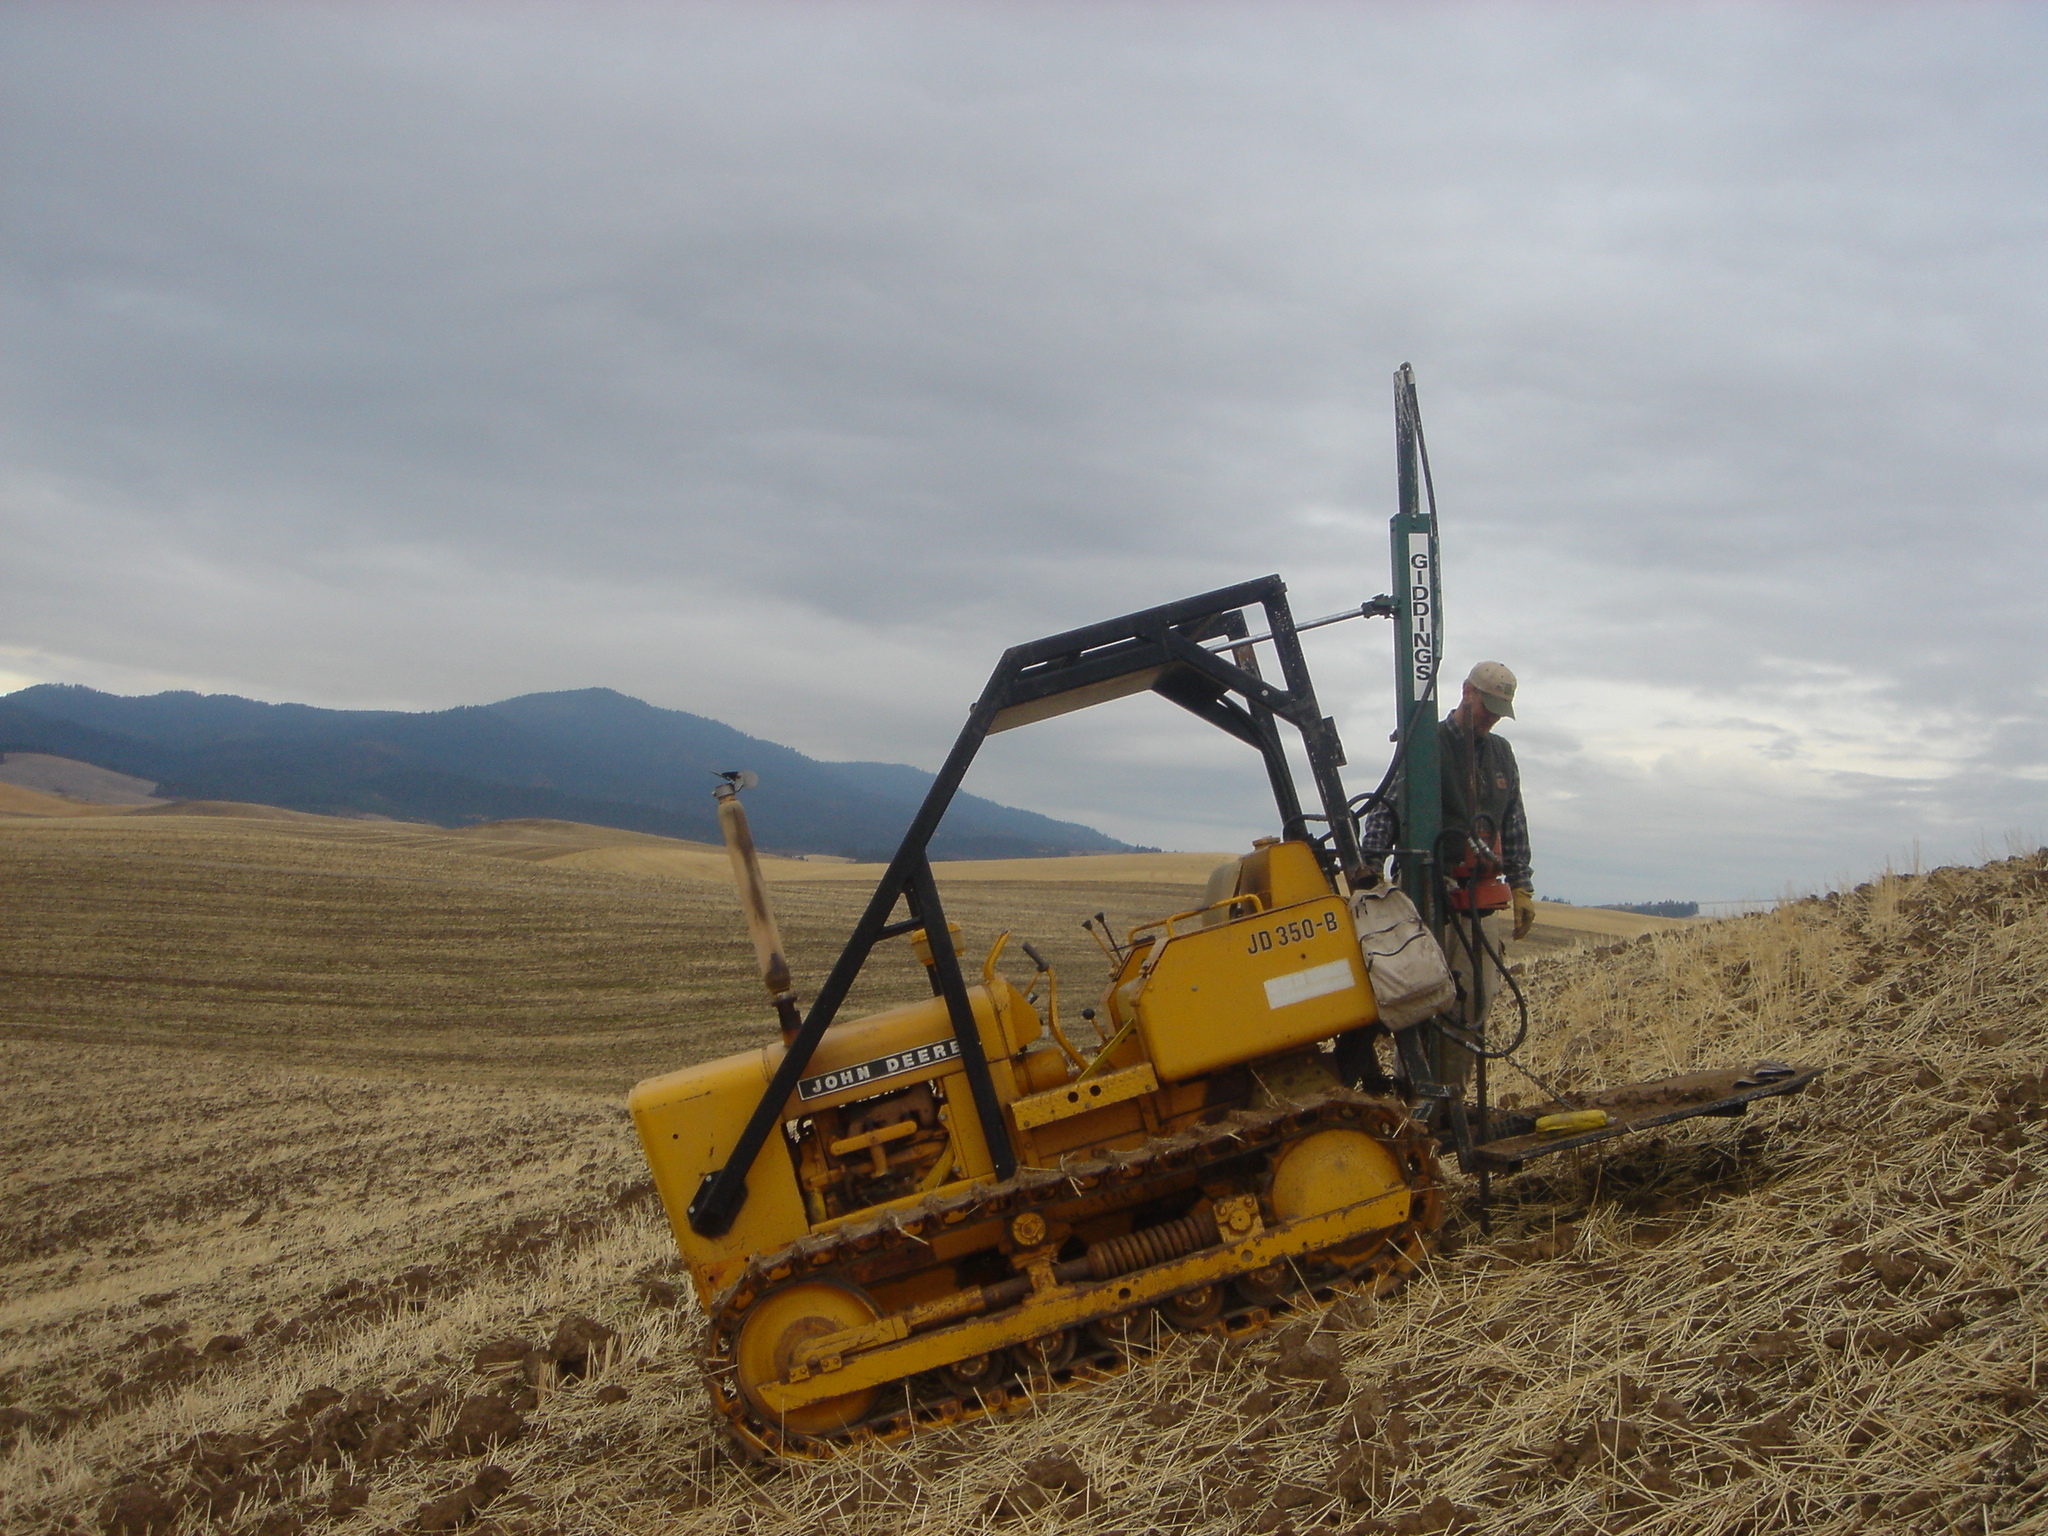
Soil moisture sensor, soil cores and Giddings probe are means of testing and mapping soil.
Variability in crop yield and soil moisture
Spatial variability in a field is highly significant, and amounts to a factor of three or more for crops (and up to an order of magnitude more for soils. In a 2002 study, Hupet and Vanclooster found that, for a relatively flat 1.6-acre field, up to 33 samples were needed to predict mean soil moisture with 95% confidence. Because soil moisture and soil characteristics, such as clay content, vary with topography, in the Palouse region, our rolling hills make comparing point-source data even more complicated.
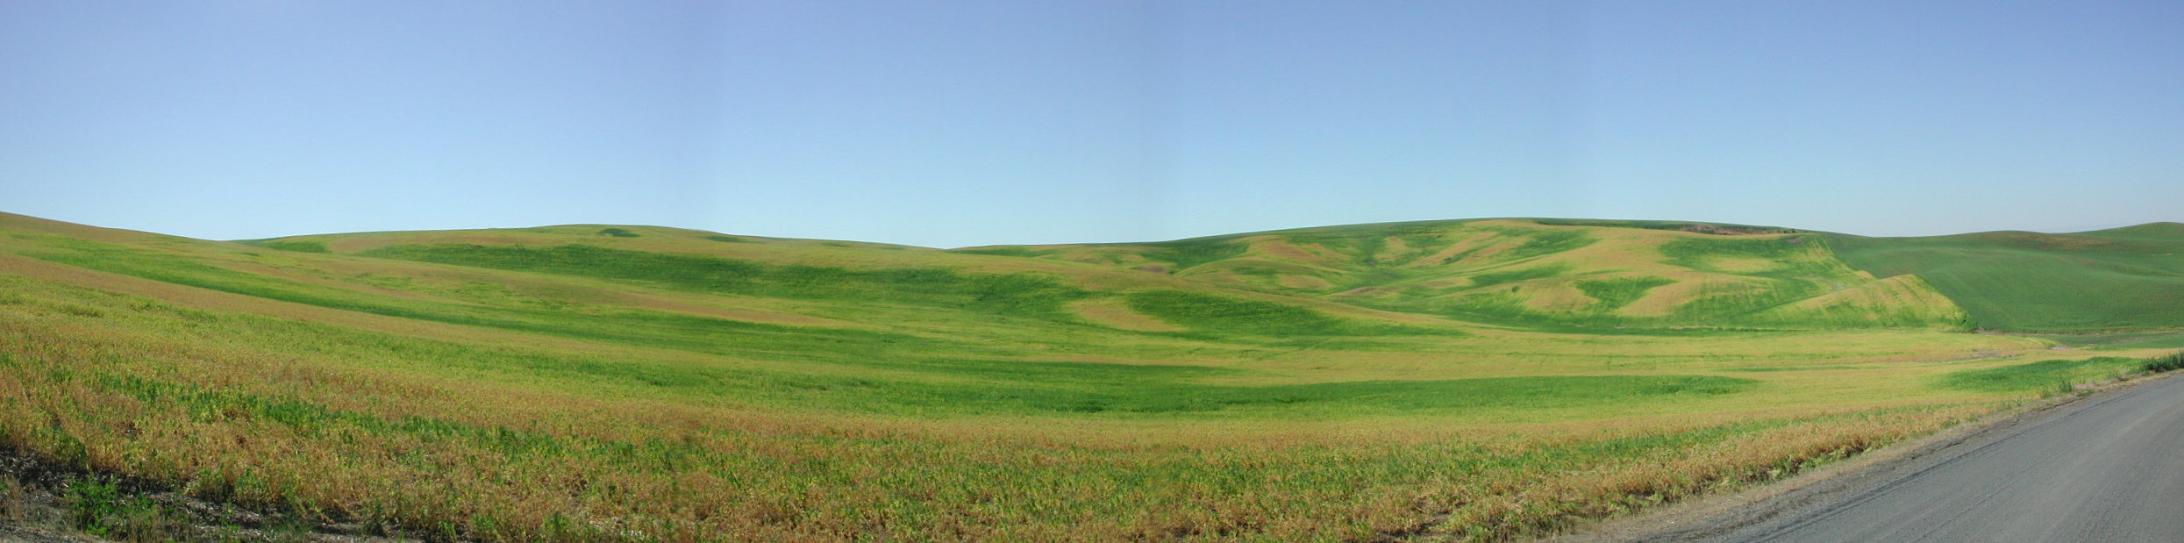
One example of field-scale variability in the Palouse with visible changes in crop yield.
New Technology
New advances in technology have enormous potential when it comes to mapping field scale variability. Two technologies highlighted in this project are NDRE and EMI. Both of these technologies create spatial and temporal maps of a field.
NDRE, or Normalized Difference Red Edge, maps near infrared bands more sensitive to chlorophyll. This rapid eye satellite imagery gathers data of “the greenness of fields” every 15 days, with a 5-meter resolution.
Electromagnetic induction, or EMI, is a measure of soil electrical conductivity. EMI sensors have a transmitting coil on one end, and a receiving coil on the other, creating an electromagnetic field with strength proportional to soil electrical conductivity. Higher clay content and higher moisture content are both associated with higher electrical conductivity. We used the CMD Mini-Explorer in the project this summer.
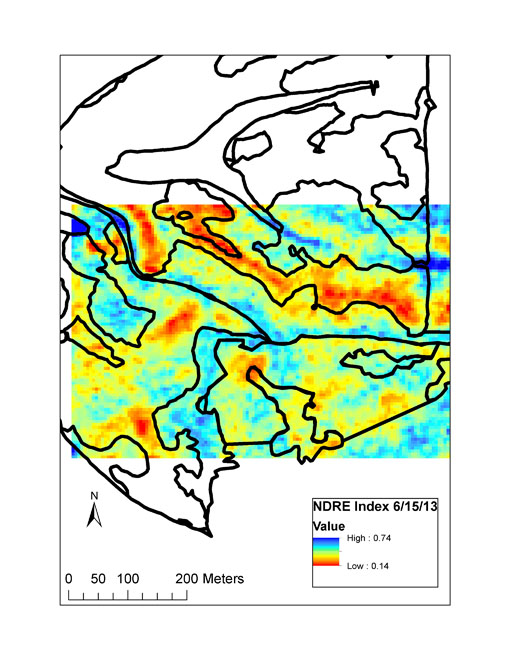
NDRE map overlaid with the variable nitrogen fertilizer rate map generated by the farmer at the Leland field site. Note that, in some areas, the patterns of the NDRE closely follow the nitrogen fertilizer rate map. The CMD Mini-Explorer to collect EMI information.
Factors affecting Electrical Conductivity
Many factors affect electrical conductivity, and so a measure of EC can be a good way to look at a variety of factors, such as:
- Soil texture
- Bulk soil density
- Water content
- Soil salinity
- Soil Freezing
Clay has a high electrical conductivity. A thesis by Megan Wessel found that measured volumetric water content had a strong relationship with volumetric water content as predicted by electrical conductivity readings from the EMI sensor.
In my summer project we examined changed in electrical conductivity and soil moisture to delineate management zones for prescriptive, site-specific management, that is, precision agriculture. We generated preliminary results this summer by comparing EMI data to soil properties, water content, topographic properties, NDRE, and crop yield data. However, at this point, both the EMI and NDRE maps must be used in conjunction with other tools to delineate precision agriculture management zones.
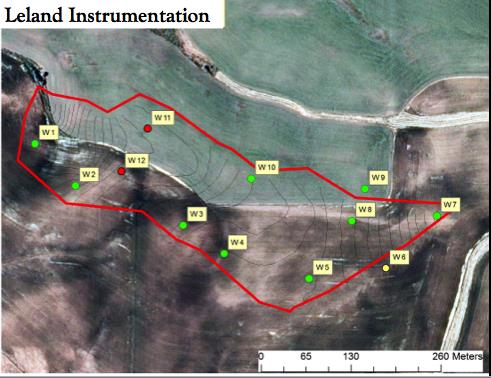
Each of the 12 plots at the Leland study site had a soil sensor that measured volumetric water content and soil moisture at every foot up to five depths. The watershed is outlined in red.
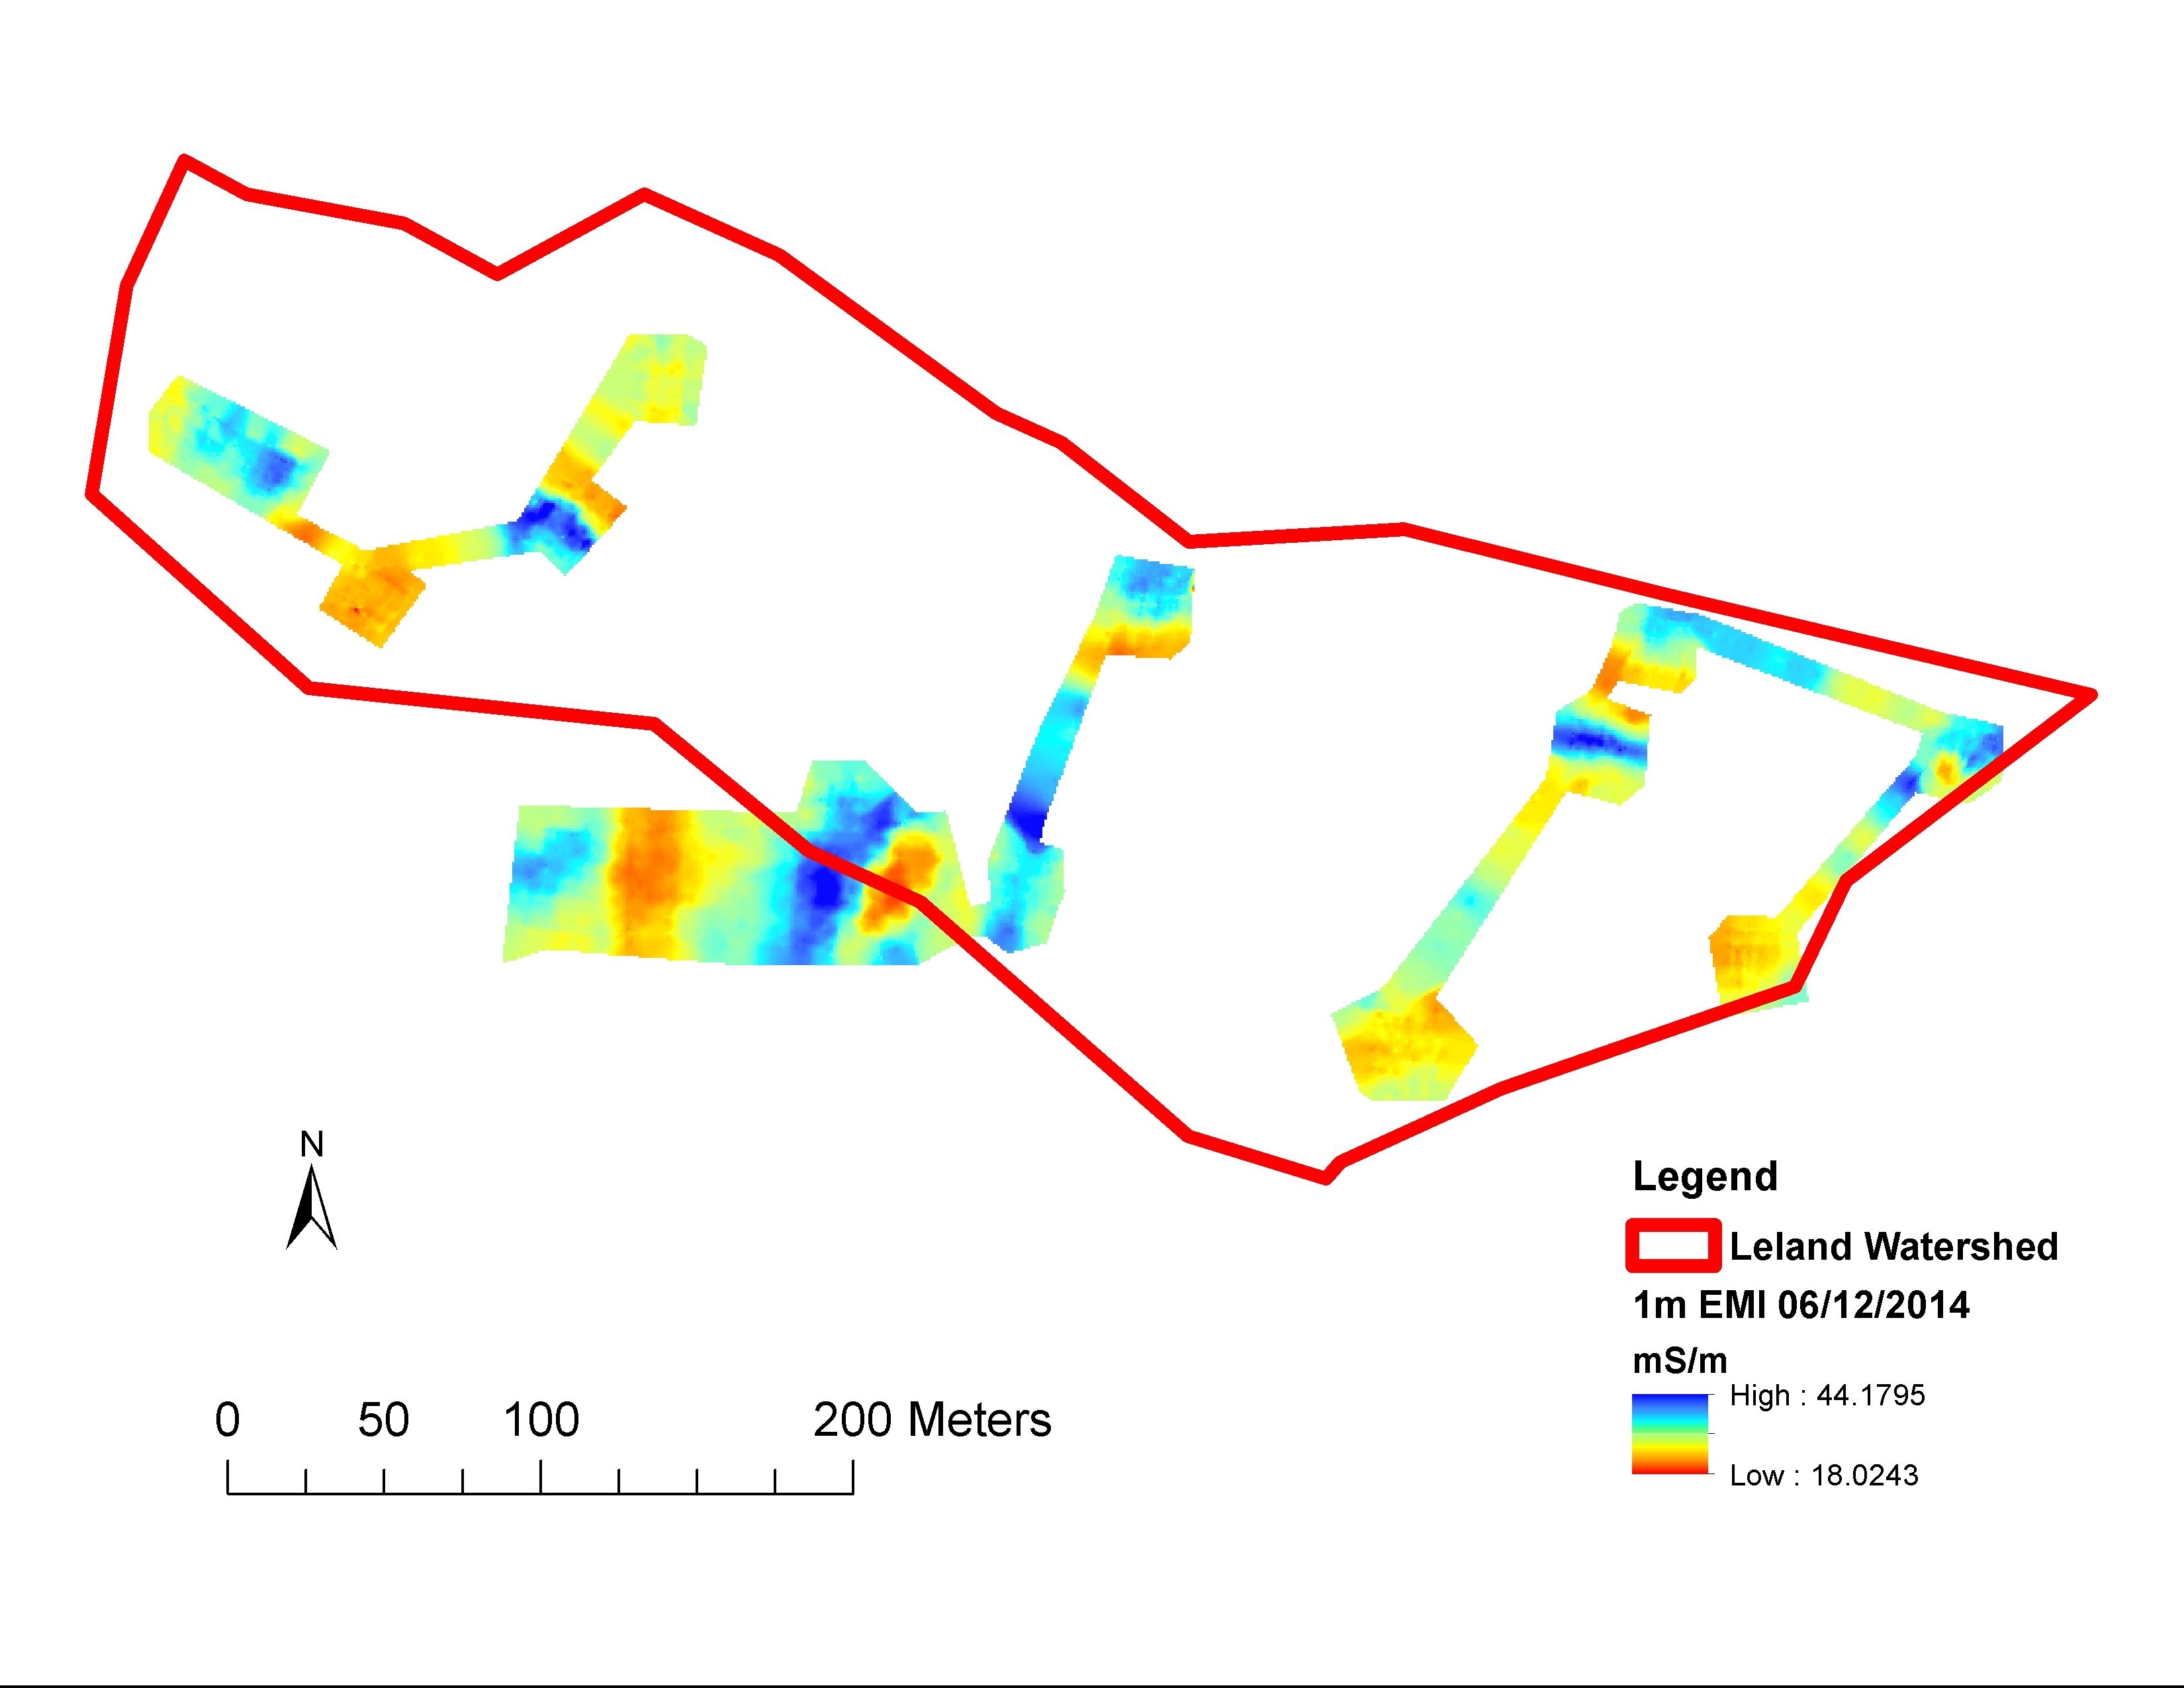

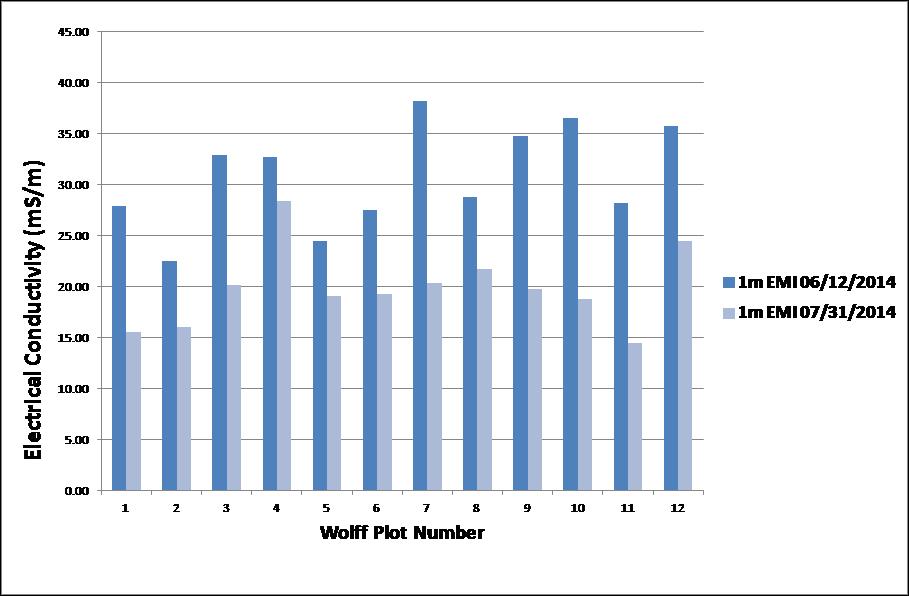
We made EMI maps in large plots around each of the sensors. It is obvious to see that the second image (with measurements taken at the end of the summer, when it is drier) shows lower EC values than the first. Beginning- and end- of summer EMI readings at each of the 12 soil sensor plots show a significant decrease in EC over the growing season (as it dried).
The Site-Specific Climate-Friendly Farming project will continue to explore the information both NDRE and EMI can provide, as well as incorporating crop modeling with CropSyst to further understand crop and hydrologic responses of different management zones.
REACCH Undergraduate Summer Interns come from all over the country to spend 9 weeks with REACCH scientists conducting research, gaining job and graduate school training, and sharing their experiences. These blogs are the culmination of their research experience.
Editor: Leigh Bernacchi

Soil Cores
If you’re interested in climate and agriculture, continue reading articles at the blog aggregator, AgClimate.net